


Knowing how to create an infographic can turn a long, dense transcript into a visual that people actually read and remember. Most of us sit on hours of recorded meetings, lectures, and interviews that almost nobody wants to scroll through as plain text. Video Transcriber AI closes that gap with its Summary Infographic feature, which takes your transcript, distills it into a summary, and turns it into a polished visual in minutes. This guide walks you through how to create an infographic the easy way, from raw audio to a finished graphic you can share anywhere. Once you learn how to create an infographic, every recording you own becomes a potential visual asset.

What Is an Infographic?
An infographic is a visual that presents information in a scannable, easy to grasp form. Instead of a wall of paragraphs, you get icons, short headings, charts, and highlights that tell the story at a glance. For creators, students, and professionals, learning how to create an infographic is one of the fastest ways to make dense content feel lighter. When you pair that with a transcript you already have, the result is even more powerful: your words become the raw material, and the infographic becomes the finished product. Understanding what makes a good visual is the first step in how to create an infographic that actually gets read.
Key Elements of a Great Infographic
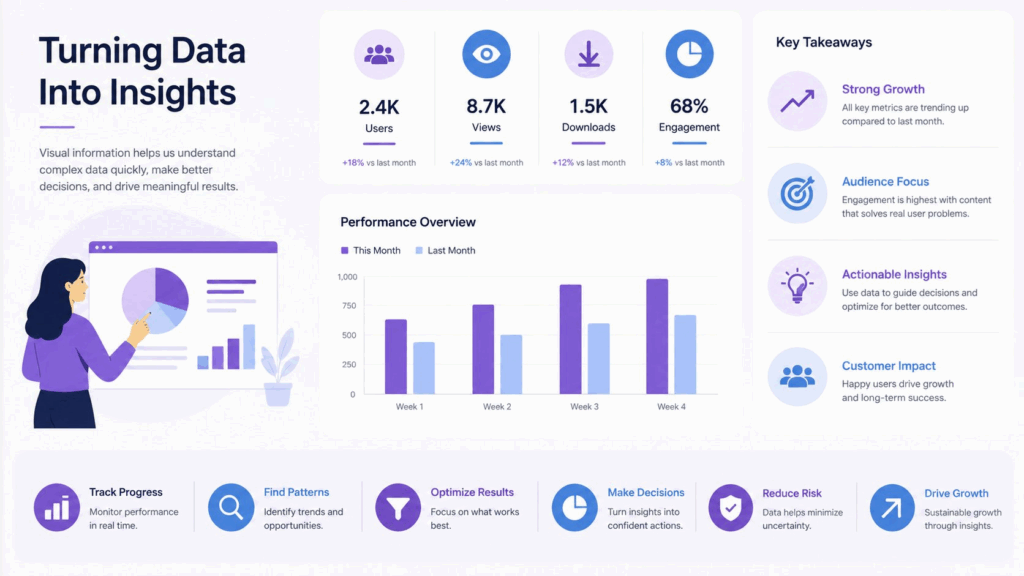
A strong infographic has a clear headline, a logical flow from top to bottom, and a small set of key points rather than every detail. Good visuals use consistent colors, readable fonts, and enough white space to breathe. Most importantly, a great infographic does one job: it turns the main idea of your content into something a reader can absorb in seconds. That is exactly what Summary Infographic is designed to do, which is why so many people reach for it when they want to learn how to create an infographic from a transcript.
Infographic vs. Plain Text Summary
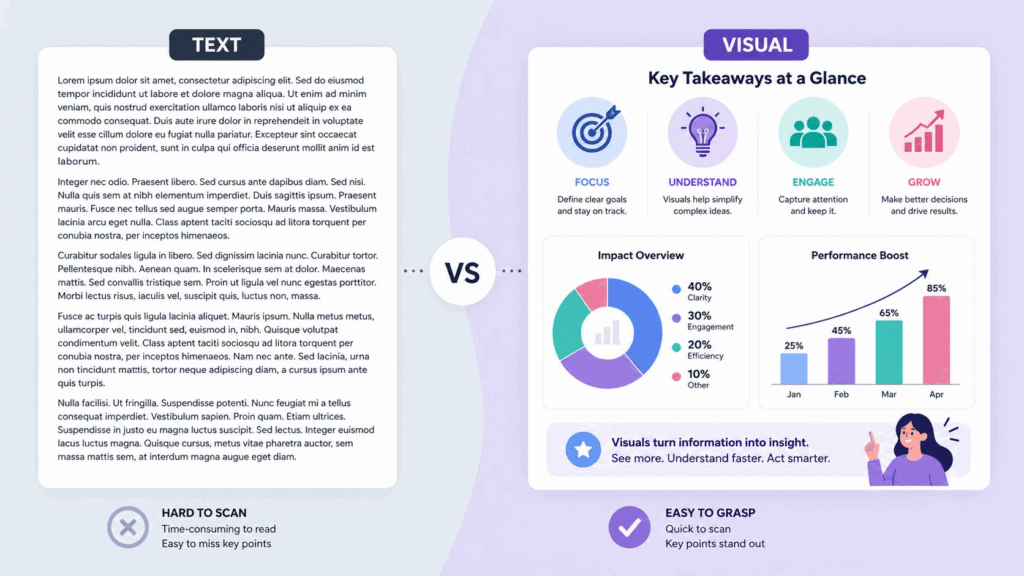
A plain text summary is useful, but it still asks the reader to read. An infographic lets the reader see the structure immediately. If you have ever watched someone skip a perfectly good summary because it looked like homework, you already understand the difference. When you learn how to create an infographic, you give your ideas a visual layer that a text block simply cannot match. This is why the transcript to infographic flow is becoming a favorite for study notes and social posts alike.
| Aspect | Infographic | Plain text summary |
| Reading style | Scanned in seconds | Read line by line |
| Key points | Highlighted as visuals | Buried in paragraphs |
| Shareability | High, built for social media | Low, rarely shared |
| Memory | Sticks with the reader | Fades quickly |
| Creation time | Minutes with Summary Infographic | Fast to write, slow to consume |
Once you see the side by side, the choice is clear: learning how to create an infographic is worth it for anything you plan to share.
Why Create an Infographic from Your Transcripts?
There are a lot of reasons to turn transcripts into visuals, but three stand out. Each one ties directly to what Summary Infographic does best, and each one is a reason to finally master how to create an infographic.
Turn Long Transcripts into Scannable Visuals
A two hour meeting transcript is intimidating. A one page infographic of that same meeting is inviting. When you know how to create an infographic, you can compress a long recording into the handful of points that actually matter. Readers get the gist in ten seconds, and you look more organized in the process. That is the whole promise of the transcript to infographic workflow, and it is the simplest reason to learn how to create an infographic.
Save Time with Ready-Made Templates
Designing a graphic from scratch takes forever. Choosing colors, arranging blocks, and picking fonts is a project on its own. Summary Infographic removes that burden with ready made templates, so you do not start from a blank canvas. You pick a layout you like, drop in your content, and move on. That is the fastest way to learn how to create an infographic without touching a design tool.
Make Content Shareable and Memorable
People share visuals far more than they share text. A crisp infographic travels on social media, gets saved for later, and sticks in the memory longer than a paragraph ever will. When you learn how to create an infographic from your transcripts, you turn private notes into public ready assets. That shift is what makes the feature worth using again and again, and once you understand how to create an infographic, sharing becomes second nature.
How to Create an Infographic: Step-by-Step Guide with Summary Infographic
Now for the hands on part. Here is how to create an infographic from a transcript using Video Transcriber AI, in five simple steps. Follow them once and you will have a repeatable workflow for every how to create an infographic project you take on.
Step 1: Upload Your Audio or Paste Your Transcript
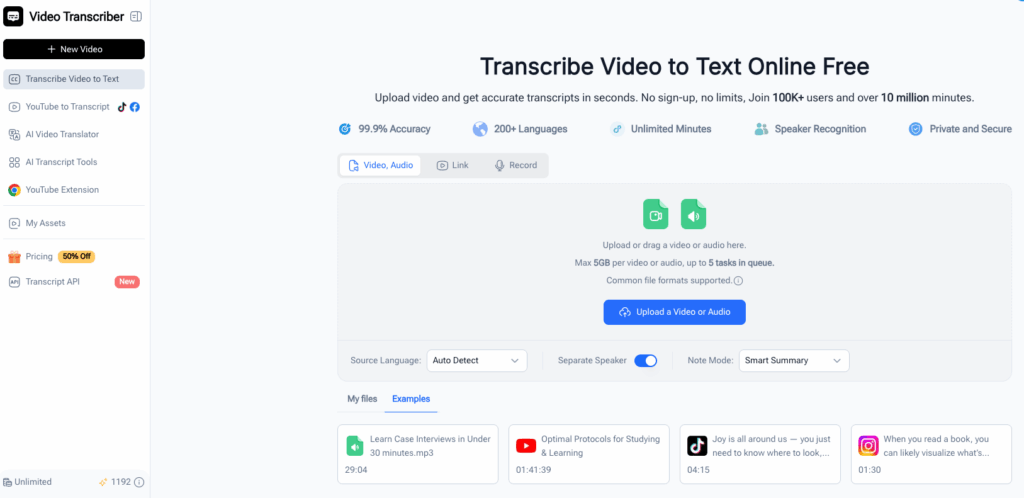
Open Video Transcriber AI and start with your source material. You can upload an audio or video file and let the tool transcribe it, or paste an existing transcript you already have. If you have a recording of a meeting, lecture, or interview, drop it in and let transcription run. This is the starting point for every transcript to infographic project, and it is the first half of learning how to create an infographic.
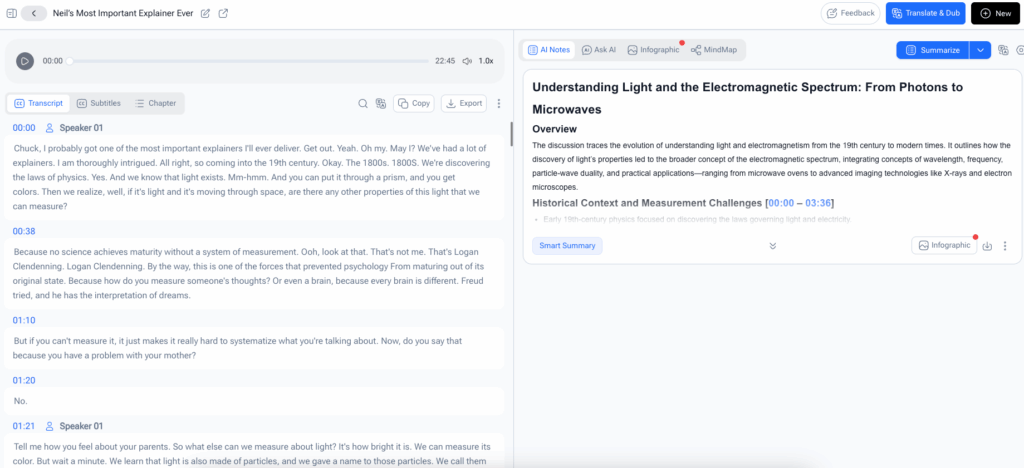
Step 2: Generate a Summary from Your Transcript
Once your transcript is ready, generate a summary. The tool pulls out the main points, key takeaways, and action items, so you do not have to reread the whole thing to find the signal. This summary becomes the raw content for your infographic. It is the bridge between a long transcript and a tight visual, and it is where the summary infographic workflow starts to shine. This single step is the heart of how to create an infographic from your own content.
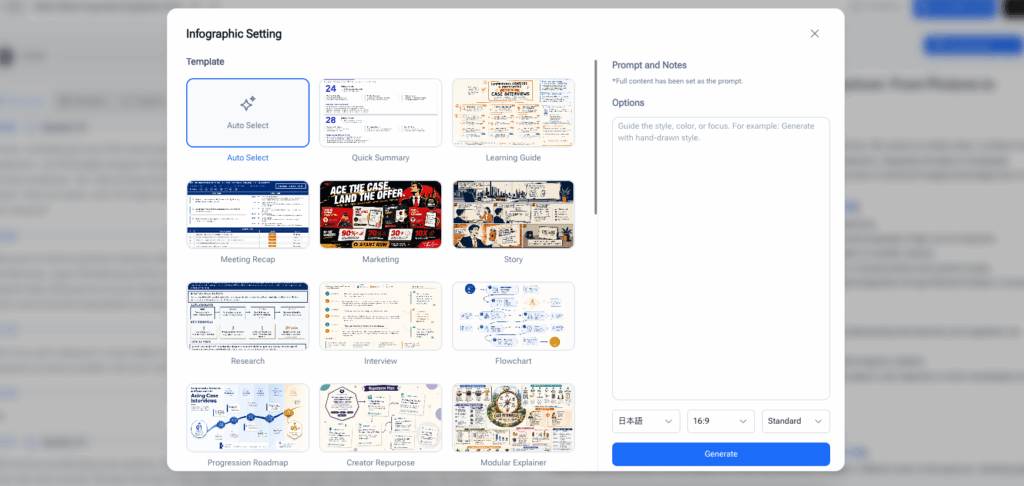
Step 3: Pick a Template or Write Your Own Prompt
Here is where you choose how the infographic will look. Summary Infographic offers a library of templates, so you can pick a style that fits your content, whether it is a study guide, a meeting recap, or a social post. If you want something more specific, you can write your own prompt to describe exactly what you want. This flexibility is what makes it easy to master how to create an infographic that matches your own taste.
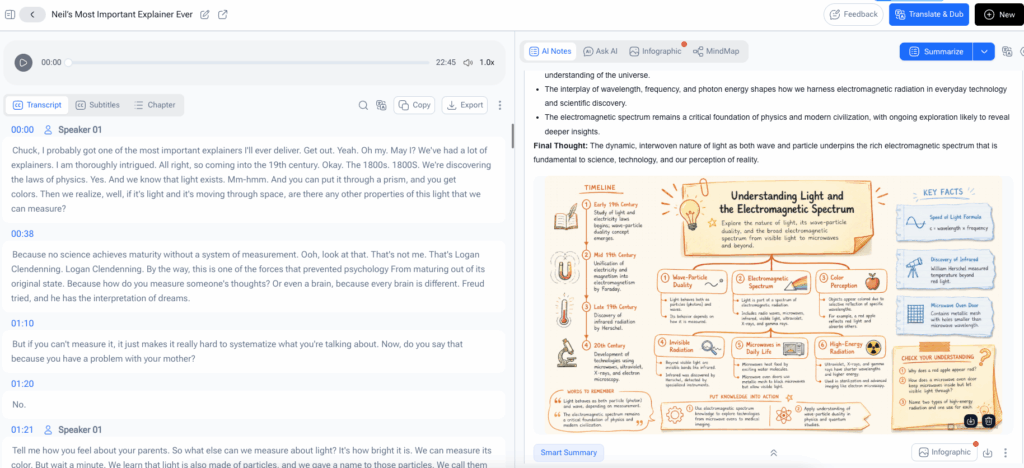
Step 4: Generate the Infographic with GPT Image 2
Hit generate and let the AI work. The infographic is created with GPT Image 2, a model built to produce clean, readable visuals from your summary and prompt. In a moment you get a finished graphic that combines your content with a layout you picked. This is the step where the whole how to create an infographic question gets answered for you, because the heavy lifting is already done. From here, how to create an infographic is no longer a question, just a button click.
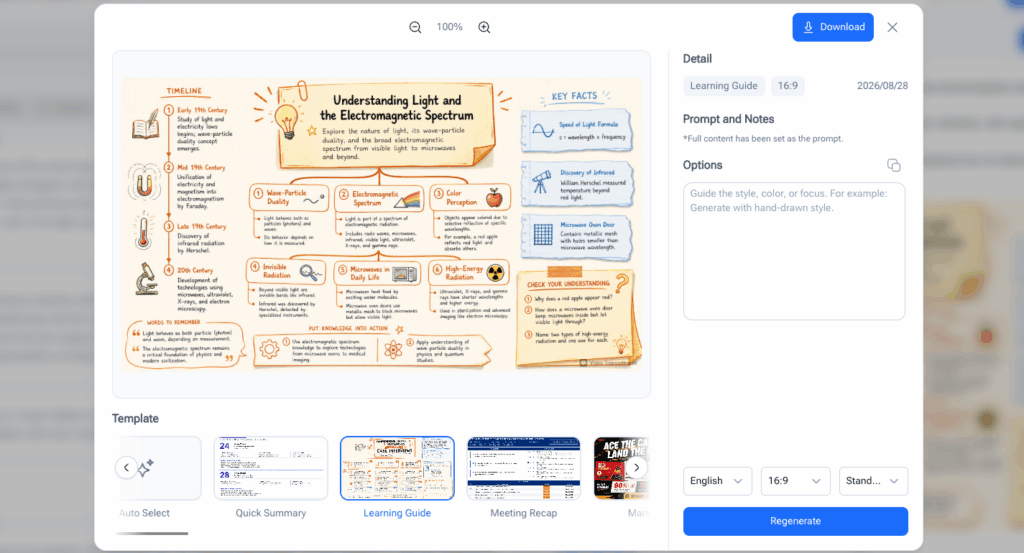
Step 5: Download and Share Your Infographic
When the result looks good, download it and put it to work. Save it as an image, drop it into a presentation, post it on social media, or add it to your notes. Because you can always go back, tweak your prompt, and generate again, the first version is never your last. That is the beauty of learning how to create an infographic this way: iteration is free and fast, and every attempt teaches you more about how to create an infographic.
Pro Tips for Better Infographics with Summary Infographic
A good tool gets better when you use it well. These three habits will lift the quality of every infographic you make, no matter how long you have been practicing how to create an infographic.

Tip 1: Keep Your Prompt Specific and Clear
When you write your own prompt, be concrete. Say what the infographic is about, what style you want, and which points to highlight. A vague prompt produces a generic result, while a specific one gives the model clear direction. This single habit is the biggest quality boost in any how to create an infographic workflow, and it works especially well with GPT Image 2.
Tip 2: Match the Template to Your Content Type
Different content calls for different layouts. A study guide benefits from clean, sectioned blocks, while a social post wants something bolder and more visual. Before you generate, ask what this infographic is for, then pick the template that fits that job. Matching the layout to the purpose is a simple rule that applies to every how to create an infographic project.
Tip 3: Refine with a Follow-Up Prompt
Your first infographic rarely has to be your last. If something is off, tweak the prompt and generate again. Change a phrase, add a point, or ask for a different color scheme. Because regeneration is quick, you can iterate until it feels right. This is how professionals approach learning how to create an infographic: they refine, not restart.
Real-World Examples: How People Use Summary Infographic
Nothing makes the value clearer than seeing it in action. Here are two common ways people use Summary Infographic when they need to learn how to create an infographic from their transcripts.
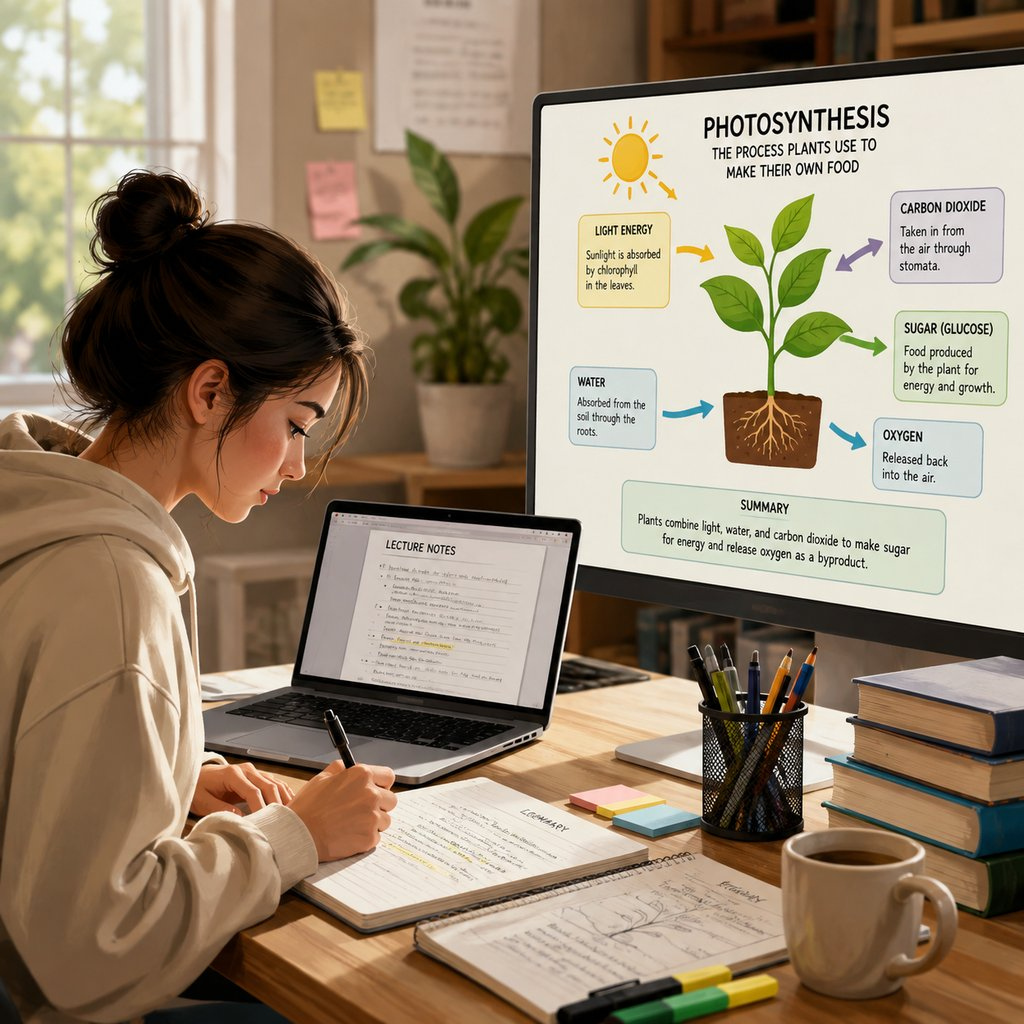
Example 1: A Student Turning Lecture Notes into a Study Infographic
A student records a two hour lecture and uploads it to Video Transcriber AI. After transcription, she generates a summary, picks a clean study template, and produces a one page infographic of the key concepts. Instead of rereading her notes the night before an exam, she reviews a single visual that captures the whole lecture. That is the transcript to infographic shortcut at its best, and it shows how to create an infographic in a real study routine. For students, knowing how to create an infographic means studying smarter, not longer.
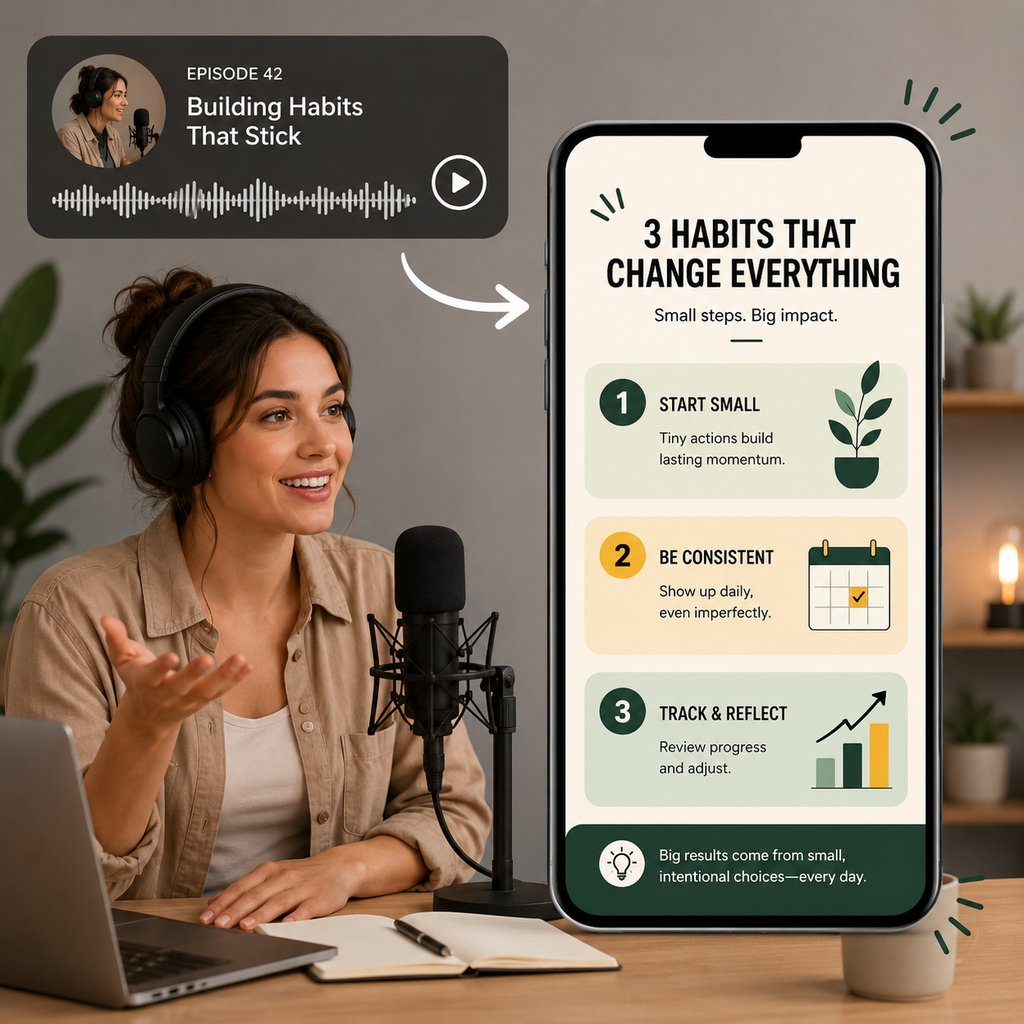
Example 2: A Content Creator Repurposing a Podcast into a Visual Post
A content creator has a podcast episode and wants to promote it. He transcribes the episode, generates a summary, then writes a prompt for a bold, social friendly infographic. In minutes he has a visual he can post to drive listeners to the full episode. One recording becomes multiple pieces of content, which is exactly why knowing how to create an infographic pays off for creators.
Frequently Asked Questions
Here are the questions people ask most often about the feature.
How Does Summary Infographic Turn Text into an Infographic?
It works in two stages. First, the tool summarizes your transcript into the main points and takeaways. Then, it uses that summary, plus your chosen template or prompt, to generate a visual. The result is an infographic built from your own content, not a generic stock graphic. That is the core of how to create an infographic from a transcript. Understanding this two step flow is the fastest way to learn how to create an infographic.
Can I Use My Own Prompt to Create an Infographic?
Yes. While there is a library of templates to choose from, you can also write a custom prompt to describe exactly what you want the infographic to look like and include. This gives you full control over the style and content. It is one of the reasons the feature stands out for people learning how to create an infographic their own way, and it puts you fully in charge of how to create an infographic.
What Templates Are Available?
Summary Infographic offers a range of templates for different use cases, from study guides and meeting recaps to social media posts and process visuals. You pick the layout that fits your content, and the tool handles the rest. Having ready made options means you can learn how to create an infographic in minutes instead of hours, which turns a design project into a quick how to create an infographic session.
Which AI Model Powers the Infographic Generation?
The infographic is generated with GPT Image 2, a model known for producing clean, readable, and visually consistent graphics. It takes your summary and prompt and turns them into a polished image. That model is what makes the how to create an infographic process feel effortless on the platform. When you understand how to create an infographic with GPT Image 2, the whole workflow clicks into place.
Conclusion
Learning how to create an infographic does not have to mean learning design. With Video Transcriber AI, your transcript becomes a summary, and your summary becomes a visual, all in one place. Whether you are a student turning lectures into study guides or a creator repurposing a podcast, the Summary Infographic feature helps you learn how to create an infographic in minutes, with templates and custom prompts powered by GPT Image 2. If you have ever wanted to turn a long recording into a beautiful visual without the hassle, now you know exactly how to create an infographic. The best part of how to create an infographic this way is that you need no design skills, no expensive software, and no extra hours.
Head to how to create an infographic with Video Transcriber AI, upload your audio, and watch your transcript turn into something worth sharing. That is everything you need to know about how to create an infographic from a transcript. Once you try how to create an infographic with Summary Infographic, you will wonder why you ever scrolled through a wall of text. So stop reading about how to create an infographic and start doing it: your next transcript could become a visual in minutes. Master how to create an infographic once, and every transcript you touch becomes more useful.